
Gains of 100% in 6 months! Is it still wise to own this shipbuilding stock?
In the previous six months, Mazagon Dock Shipbuilders Ltd. has more than doubled investors’ wealth, but in only three months, it became rangebound.
On the weekly charts, however, the stock is currently displaying indications of bottoming out as the price broke out of a downward-sloping channel.

Experts advise short-term traders to purchase the stock in the next four to six months with a target price of Rs 5,870.
The stock increased 109% during the previous six months, from Rs 2,158 on April 18, 2024, to Rs 4,526 on October 18, 2024.
On July 5, 2024, the stock reached a record high of Rs 5,859, following the trend, but it was unable to maintain it. It dropped more than 30% before gaining stability.
On the weekly charts, it found support over 3,800 levels and recovered. The stock was able to recover the 21-DMA on the weekly charts thanks to the momentum. For the past two weeks, it has been hitting higher lows.
On the daily charts, the stock is trading significantly above the majority of important short- and long-term moving averages, including the 5, 10, 30, 50, 100, and 200-DMA.
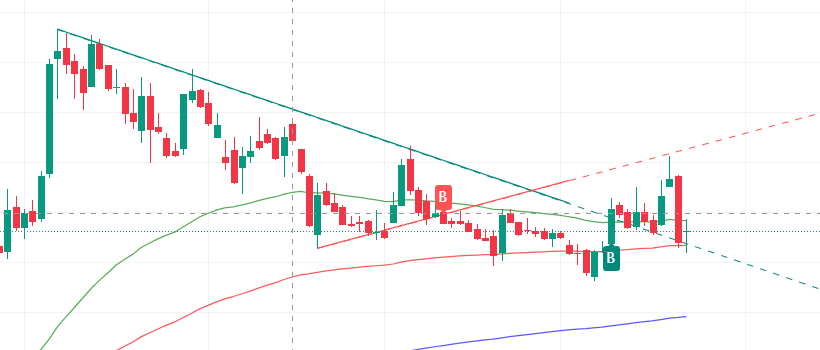
On the weekly charts, the stock broke out of a downward channel, indicating that bulls are attempting to seize control and that the momentum is here to stay.
A crucial component of a technical analysis tool that traders use to decide when to join and exit trades are channel lines, sometimes referred to as trend lines.
It establishes price goals and stop loss levels in addition to assisting in deciding when to join and exit transactions.
The market’s trend and volatility are reflected by the channel line, which is made up of two parallel trend lines that contain price activity within a certain range.
The upper trend line, sometimes referred to as the resistance line, is the point at which selling pressure frequently increases and impedes price growth.
The lower trend line, also known as the support line, shows where purchasing interest usually appears and stops further price declines.
According to Bhavik Patel Sr., Research Analyst at Tradebulls Securities, “there are basically three main types of channel lines: one is ascending, the second is descending, and the last is horizontal.”
“As prices fluctuate within a defined range, the formation of these channels highlights the equilibrium between buyers and sellers,” he added.
On the weekly chart, Mazagon Dock Shipbuilders has shown a breakthrough from the descending channel line. Patel emphasized that the first time it gave a positive RSI crossing was in October (price 4,520), following a negative crossover in July (price 5,430). The crossover was validated by the channel line breakthrough.
“Mazagon has validated and confirmed the breakout with a weekly closing above the trendline. The breadth of the channel line, calculated from the highs and lows, would be the technical aim, he said.
“The weekly low of the previous candle, which is around 3,870, is the stop loss, and the target is around 5,870,” Patel continued.
Disclaimer: The information in the aforementioned article is news and educational in nature; it is not a suggestion for a purchase or sale. Before making any financial decisions, users are advised by TraderPulse to consult with qualified professionals.


3 thoughts on “Gains of 100% in 6 months! Is it still wise to own this shipbuilding stock?”